Thursday, July 31, 2014

Are Robo-Advisors Poised to Take Over?

It’s what some are starting to call “a digital wealth management revolution.”

Advances in digital technologies have made it possible for new financial tech companies to pop up in the wealth management space, challenging traditional advisory models.

One has to look no further than the amount of money being pumped into these startups to see this.

Investment in financial technology tripled between 2008 and 2013 from $928 million to $2.97 billion and is expected to double again to between $6 billion and $8 billion by 2018, according to a report by Accenture. The first quarter of 2014 was the most active on record, with $1.7 billion invested globally. Investment in financial technology in the United States alone could reach $4.7 billion annually by 2018, reports Accenture.

“The big story today is the wrath of upstarts who are entering the retail financial services space who are using digital technology to create great customer experience at a lower cost than incumbents can,” said Bill Doyle, vice president and principal analyst at Forrester Research, during a new webinar, “Understanding The Digital Wealth Management Revolution” provided by Xignite, a cloud-based market data provider based in San Mateo, California.

Doyle pointed to companies like Betterment, LearnVest, Wealthfront and Jemstep as examples of growing upstarts. Adding that three digital investment managers now have more than $2 billion in assets under management— AssetBuilder with $635 million as of April 14, Betterment with $500 million as of April 14 and Wealthfront with $1 billion as of June 14.

“In a wealth management industry that’s measured in trillions of dollars, these digital investment managers are still tiny, but they’re establishing a foothold in a managed accounts market that has been dominated by advisor-based firms like Ameriprise and Raymond James,” Doyle said during his webinar presentation.

This is driven in part by consumers becoming increasingly digitally savvy, creating what Doyle is calling “a mobile mind shift.”

More than a quarter of U.S. adults have made the mobile mind shift, and Doyle said this will continue to rise as more older adults connect with more devices.

“The shifted customers expect that any desired information or service is going to be available on any device at their moment of need,” Doyle said. “They judge firms on their ability to deliver.”

Interactions where in-person communication would once have been preferred, such as advisor meetings with clients, are now happening online.

Doyle said consumers turn to digital channels first to research products, and once they’ve made a decision on an investment product, they transact digitally because it’s easier. He added that clients choose to stay in touch through digital channels because it’s better; they would prefer digital documents over paper.

And millennials, by nature, are digitally astute. Andy Rachleff, executive chairman of the automated investment service provider Wealthfront, credits millennials for the birth of his firm.

“There’s an enormous population of clients that is currently not served by the investment management industry, and they are the millennial generation,” Rachleff said in the webinar. “That’s because the average account size for millennials does not meet the required minimum of the existing suppliers.”

Collectively, Rachleff added, the millennial generation has more than $2 trillion of investable assets, expected to grow to $7 trillion over the next five years.

“In total, this generation is likely to have more assets to manage than the baby boomer generation and there are going to be many more of them,” he said.

The thing about millennials is they “have very different interests in what they want from an investment management solution than what their parents want.”

Rachleff said they want something automated, passive and low-cost.

“In other words, they want an automated investment service,” he said.


---

Related on ThinkAdvisor:

Wednesday, July 30, 2014

IBM Corporation: Looking Beyond its Near-Term Troubles

International Business Machines' (NYSE: IBM  ) second-quarter report wasn't up to the mark, even though the company beat revenue and earnings expectations. Analysts picked on IBM's slower-than-expected growth in software, which grew just 1% from last year, compared to an expectation of 3%. However, IBM expects this segment to get back on track in the second half of the year, projecting growth in the mid-single digits.

Moreover, IBM recently signed a deal with Apple (NASDAQ: AAPL  ) , which will improve its enterprise software business. In addition, the company is already tapping data centers and cloud computing with a number of solutions. So, investors need to look beyond a small hiccup in IBM's latest earnings and focus on the long run. 

Investing for the future
IBM is seeing double-digit growth in emerging technologies in enterprise IT. The company is focused on driving innovation, apart from stability, in its core franchises.

In the first quarter, IBM launched its cloud platform-as-a-service for the enterprise, known as Bluemix. In addition, IBM made an investment of $1.2 billion to expand its SoftLayer cloud hubs globally, apart from investing $1 billion to bring the Watson supercomputer's cognitive capabilities to the enterprise segment.

IBM expanded the availability of Bluemix in the second quarter, and also opened new SoftLayer data centers. IBM plans to invest $3 billion for the next five years in research and initial-stage development to create the next generation of chip technologies. With this move, the company expects to address the growing need for cloud, big data, and cognitive systems.

The Apple deal will be a boost
IBM's partnership with Apple is a step in this direction. The two companies entered into a strategic global partnership to deliver mobility solutions to enterprise clients. The partnership aims at delivering a new class of enterprise-ready, mobile-first business applications for iOS. According to the press release announcing the partnership, IBM will help develop more than 100 industry-specific native apps for enterprise deployment, and optimize its cloud services for iOS devices.

This deal should be profitable for both companies. IBM will be able to offer a robust suite of enterprise applications for mobile devices. Apple, on the other hand, will see an increase in sales of iPhones and iPads to IBM's enterprise clients. Through this partnership, IBM's consultants and other client-facing specialists will be able to improve mobile device productivity, thereby enabling big data and analytics in an efficient manner.

Emerging markets
The company is already reporting good growth in emerging markets. For example, IBM's Brazilian market grew more than 20% year over year in the previous quarter, driven by large deals in the financial sector. The company is also seeing a better business environment in India.

IBM is further expanding its footprint in emerging markets, and has opened a cloud data center in Hong Kong. The company recently opened another data center in London during the second quarter and plans to launch additional capacity in the third and fourth quarters as well.

Looking ahead, IBM aims at sustaining this healthy growth, driven by its focus in strategic areas such as mobile and security. In addition, growth in some of its core franchises, such as app servers and distributed databases, will also fuel its development.

The bottom line
Finally, IBM's valuation looks attractive. A trailing P/E of 13 and a forward P/E of almost 10 suggest that the company's earnings will increase. Moreover, IBM is cheaper than the industry average P/E ratio of 17. The company also pays an impressive 2.4% dividend, which should reward investors for their patience as IBM transitions its business.

Risk-free for 30 days: The Motley Fool's flagship service
Tom and David Gardner founded The Motley Fool over 20 years ago with the goal of helping the world invest...better. Their flagship service, Stock Advisor, has helped thousands of investors take control of their financial lives and beat the market. Click here to sign up today.

Tuesday, July 29, 2014

3 Stocks Spiking on Big Volume

DELAFIELD, Wis. (Stockpickr) -- Professional traders running mutual funds and hedge funds don't just look at a stock's price moves; they also track big changes in volume activity. Often when above-average volume moves into an equity, it precedes a large spike in volatility.

>>5 Toxic Stocks You Should Sell Now


Major moves in volume can signal unusual activity, such as insider buying or selling -- or buying or selling by "superinvestors."

Unusual volume can also be a major signal that hedge funds and momentum traders are piling into a stock ahead of a catalyst. These types of traders like to get in well before a large spike, so it's always a smart move to monitor unusual volume. That said, remember to combine trend and price action with unusual volume. Put them all together to help you decipher the next big trend for any stock.

>>5 Stocks Under $10 Set to Soar


With that in mind, let's take a look at several stocks rising on unusual volume recently.

Dicerna Pharmaceuticals

Dicerna Pharmaceuticals (DRNA), a biopharmaceutical company, focuses on the discovery and development of treatments for liver diseases and cancers based on a proprietary RNA interference technology platform in the U.S. and internationally. This stock closed up 2.4% to $15.26 in Friday's trading session.

Friday's Volume: 350,000

Three-Month Average Volume: 157,630

Volume % Change: 100%

From a technical perspective, DRNA bounced notably higher here right off its new 52-week low at $14.36 with above-average volume. This stock has been downtrending badly for the last month, with shares moving lower from its high of $23.39 to its 52-week low of $14.36. During that downtrend, shares of DRNA have been consistently making lower highs and lower lows, which is bearish technical price action. That said, shares of DRNA have now started to bounce higher off its 52-week low with volume and it's quickly moving within range of triggering a near-term breakout trade. That trade will hit if DRNA manages to take out Friday's intraday high of $15.42 to more resistance at $16.91 and then above its 50-day moving average of $17.56 with high volume.

Traders should now look for long-biased trades in DRNA as long as it's trending above its 52-week low of $14.36 and then once it sustains a move or close above those breakout levels with volume that hits near or above 157,630 shares. If that breakout hits soon, then DRNA will set up to re-test or possibly take out its next major overhead resistance levels at $19.68 to around $21.

Align Technology

Align Technology (ALGN) operates as a medical device company primarily in the U.S. and internationally. This stock closed up 5.8% at $56.36 in Friday's trading session.

Friday's Volume: 1.80 million

Three-Month Average Volume: 1.07 million

Volume % Change: 75%

From a technical perspective, ALGN gapped up sharply higher here back above both its 50-day moving average of $53.41 and its 200-day moving average of $54.18 with above-average volume. This strong gap to the upside on Friday is quickly pushing shares of ALGN within range of triggering a big breakout trade. That trade will hit if ALGN manages to take out Friday's intraday high of $56.91 to some more near-term overhead resistance at $57.79 with high volume.

Traders should now look for long-biased trades in ALGN as long as it's trending above Friday's intraday low of $55 or above its 200-day at $54.18 and then once it sustains a move or close above those breakout levels with volume that this near or above 1.07 million shares. If that breakout kicks off soon, then ALGN will set up to re-test or possibly take out its next major overhead resistance levels at $60 to $62, or even its 52-week high at $65.10.

Constant Contact

Constant Contact (CTCT) provides online marketing tools that are designed for small organizations, including small businesses, associations, and non-profits. This stock closed up 3% at $32.76 in Friday's trading session.

Friday's Volume: 839,000

Three-Month Average Volume: 389,554

Volume % Change: 152%

From a technical perspective, CTCT jumped higher here right above its 50-day moving average of $30.60 with above-average volume. This spike higher on Friday briefly pushed shares of CTCT into breakout and new 52-week-high territory, since this stock flirted with some key near-term overhead resistance at $33.54. Market players should now look for a continuation move to the upside in the short-term if CTCT manages to take out Friday's intraday high of $33.74 with strong upside volume flows.

Traders should now look for long-biased trades in CTCT as long as it's trending above its 50-day at $30.60 and then once it sustains a move or close above $33.74 with volume that hits near or above 389,554 shares. If that move gets underway soon, then CTCT will set up to enter new 52-week-high territory, which is bullish technical price action. Some possible upside targets off that move are $35 to $40.

To see more stocks rising on unusual volume, check out the Stocks Rising on Unusual Volume portfolio on Stockpickr.

-- Written by Roberto Pedone in Delafield, Wis.


RELATED LINKS:


>>4 Big Stocks Getting Big Attention


>>Hedge Funds Hate These 5 Stocks -- Should You?


>>5 Defense Stocks to Trade for Gains

Follow Stockpickr on Twitter and become a fan on Facebook.

At the time of publication, author had no positions in stocks mentioned.

Roberto Pedone, based out of Delafield, Wis., is an independent trader who focuses on technical analysis for small- and large-cap stocks, options, futures, commodities and currencies. Roberto studied international business at the Milwaukee School of Engineering, and he spent a year overseas studying business in Lubeck, Germany. His work has appeared on financial outlets including

CNBC.com and Forbes.com. You can follow Pedone on Twitter at www.twitter.com/zerosum24 or @zerosum24.


Tuesday, July 22, 2014

It's 'peanut butter jelly time.' PBJ costs fall

peanut butter jelly Food prices have been rising, but don't fear: Not all groceries are more expensive. All the fixings for peanut butter and jelly are cheaper now than they were a year ago. NEW YORK (CNNMoney) It's peanut butter jelly time.

Food prices have been rising for six months in a row and are up 2.3% from a year ago, according to the Consumer Price Index -- an official inflation measure calculated by the Bureau of Labor Statistics each month. But don't fear: Not all groceries are more expensive.

All the fixings for peanut butter and jelly are cheaper now.

White bread prices have fallen 2.8% over the last year and canned fruit (a category that includes jelly) prices have fallen 0.7%.

Meanwhile, peanut butter costs 3.8% less than it did last year, which is a big relief after producers hiked prices in 2011.

The Bureau of Labor Statistics does not break out price details for crunchy versus creamy peanut butter, unfortunately, but according to the National Peanut Board, a farmer-funded research group, women and children tend to prefer the creamy stuff, whereas men prefer a crunchier spread.

That group also claims the average child will eat 1,500 peanut butter and jelly sandwiches before graduating from high school.

Each month, government data collectors visit or call stores around the country to track the prices of thousands of items, ranging from groceries to used cars. Once combined, that data makes up the Consumer Price Index, a key measure of inflation experienced by average American consumers.

That latest CPI was released Tuesday morning and shows inflation is tame. Consumer prices have risen 2.1% over the last year, a level that's considered normal in a gradually improving economy.

Much of the recent increase comes from energy prices, which have risen amid turmoil in the Middle East and Ukraine. Stripping out both energy and food though, shows other prices that consumers pay for goods and services are up only 1.9% over the last year.

A little inflation is considered a good thing. The Federal Reserve, for example, aims to keep prices rising about 2% a year. Why? If prices fall (aka deflation) consumers have little incentive to spend money, especially on big ticket items like cars, appliances or homes. Why buy now, if you expect prices on those things to be lower six months from now? This phenomenon can slow the economy.

As inflation gradually picks up this year, the big concern now is will ! American wages keep up with price increases?

Wages did rise slightly in June, but not enough to keep up with inflation. In fact, real hourly earnings are down just a hair -- about 0.1% from last year, according to a separate report released by BLS on Tuesday.

Federal Reserve Chair Janet Yellen wants to see wages rise faster than inflation, so American households have more buying power. If this happens, it could boost consumer spending -- the single largest driver of economic activity in the United States.

Some independent economists expect wages to rise more later this year as the job market continues to improve, but for now, workers will have to keep waiting.

Sunday, July 20, 2014

Wesdome Gold Mines: A High Grade Gold Producer With Declining Cash Costs

1 The Company

Wesdome Gold Mines (WDOFF) exlores for, mines, and develops mineral resource properties, primarily gold in Canada.

Number of shares (May 1, 2014)

111,107,591

Number of options (May 1, 2014)

3,328,116

Convertible debentures (May 1, 2014)

2,808,400

Fully diluted number of shares (May 1, 2014)

117,244,107

Share price

$0.84

Market cap

$93.3 million

Ticker

TSX:WDO,WDOFF

1.1 History

Wesdome Gold Mines was founded in 1976 and became a publicly listed company in 1999. Wesdome merged with River Gold Mines in February 2006 and again with Western Quebec Mines in July 2007. The company has produced over 1.3 million ounces of gold over the last 25 years.

nimetön.png

(Source: Wesdome)

1.2 Business Model

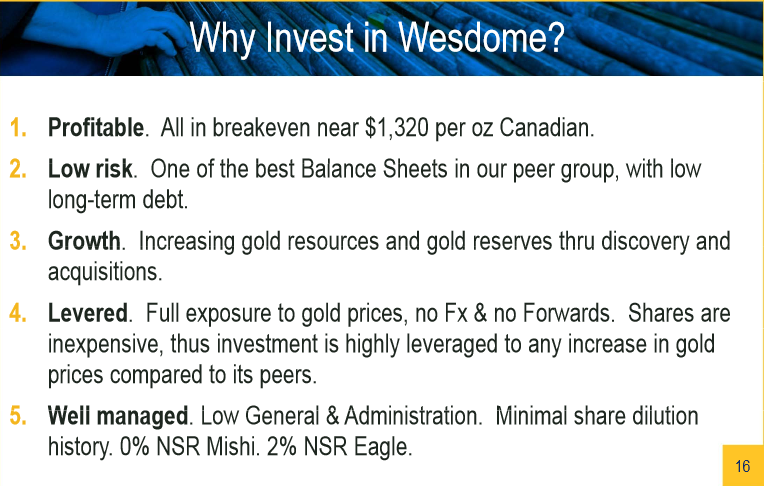
Wesdome is 100% unhedged to gold price and has never hedged. The company's strengths are quality gold deposits and an experienced, efficient operating team. Wesdome is a low-overhead, no-nonsense, owner-operated company working for its shareholders.

1.3 Mines

Wesdome has two producing mines located in Canada.

nimetön.png

(Source: Investor presentation)

Eagle River Mine

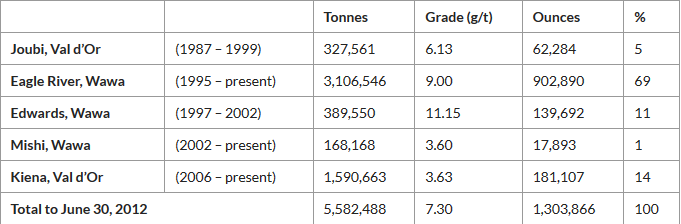
The Eagle River mine is located 50 kilometers due west of Wawa, Ontario, and 60 kilometers southeast of Hemlo. The Eagle River property was purchased in 1994 and the first gold bar was poured in October 1995. The Eagle River mine has produced more than 950,000 ounces since 1995 at an average grade of 9.1 g/tonne. In 2013, Eagle River produced 42,850 gold ounces. The production has grown 52% since 2011.

Year

2011

2012

2013

Production (ounces)

28,200

32,200

42,850

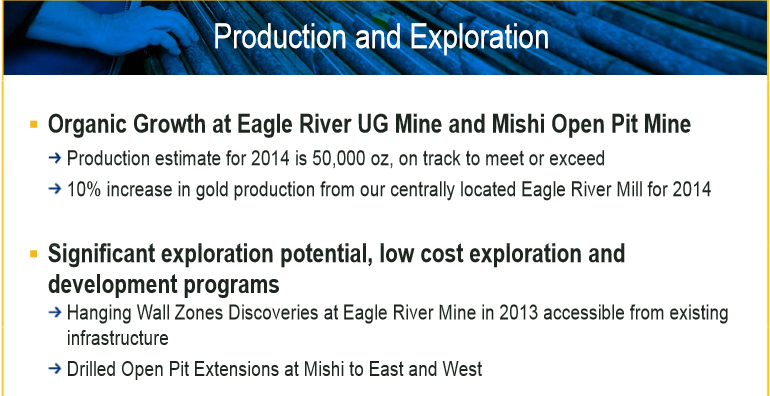
The 2014 production forecast is 44,000 gold ounces.
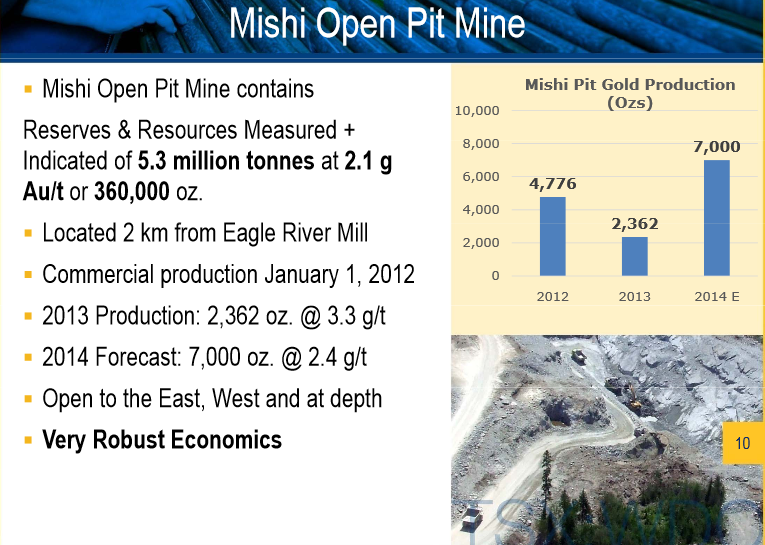
Mishi Mine

The Mishi mine is situated 15 kilometers north of the Eagle River mine and 2 kilometers from the Eagle River mill. Commercial production at Mishi mine started in January 2012. The production is expected to reach 7,000 ounces this year.

nimetön.png

(Source: Investor presentation)

Gold reserves at the Eagle River complex have grown 285% since 2008.

nimetön.png

(Source: Investor presentation)

2 Management

Rowland Uloth has been the CEO since August 2013. Collectively, Wesdome's executive team has over 70 years of industry experience.

nimetön.png

(Source: Investor presentation)

2.1 Insider Ownership

Wesdome's directors and executive officers own 2% of the company.

Here is a table of Wesdome's insider activity by calendar month.

Insider buying / shares

Insider selling / shares

July 2014

0

0

June 2014

0

0

May 2014

0

0

April 2014

5,194

0

March 2014

24,500

0

February 2014

10,000

0

January 2014

0

0

December 2013

50,000

0

November 2013

50,000

0

October 2013

50,000

0

September 2013

100,000

0

August 2013

42,800

0

July 2013

0

0

June 2013

30,000

0

May 2013

0

0

April 2013

27,000

0

March 2013

5,000

0

February 2013

0

0

January 2013

150,000

0

(Note: The table does not include shares purchased by Wesdome. Wesdome has purchased 135,700 shares during April 2013 to July 2014 time period.)

There have been 544,494 shares purchased and there have been zero shares sold by insiders since January 2013.

2.2 Compensation

Here is a table of Wesdome's executive compensation.

nimetön.png

(Source: Annual shareholders meeting)

None of the executive officers were paid base salaries more than $200,000 in 2013.

3 Operating Summary

Here is a table of Wesdome's annual gold production since 2008.

Year

Annual production (ounces)

2008

90,004

2009

96,152

2010

68,874

2011

47,747

2012

55,813

2013

52,980

The gold production peaked in 2009.

4 Financial Summary

4.1 Current Situation

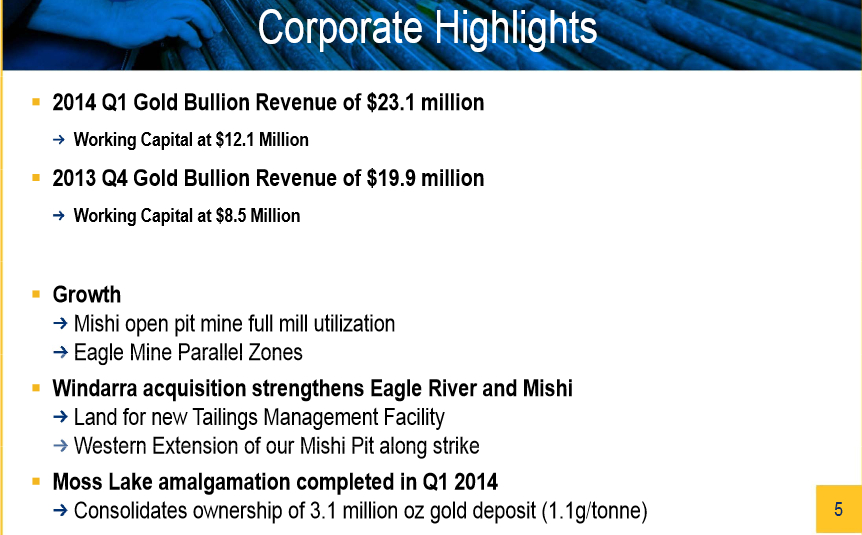
Wesdome reported the first-quarter financial results on May 1 with the following highlights:

Revenue

C$23.1 million

Net income

C$4.2 million

Cash

C$7.9 million

Debt

C$7.7 million

Gold production

13,730 ounces

Production cost

C$977 per ounce

nimetön.png

(Source: Investor presentation)

4.2 Historical Developments

Here is a table of Wesdome's revenue and earnings since 2008.

Year

2008

2009

2010

2011

2012

2013

Revenue (C$ millions)

80.3

103.5

89.4

79.6

92.3

79.7

Net income/loss (C$ millions)

9.4

32.2

5.3

0.2

-45.3

-3.9

EPS

0.09

0.32

0.05

0.00

-0.44

-0.04

Wesdome's revenue and earnings peaked in 2009.

5 Shares

Here is a table of Wesdome's number of shares since 2008.

Year

2008

2009

2010

2011

2012

2013

Number of shares (millions)

99.8

100.1

100.8

101.7

101.9

102.9

Wesdome's number of shares have grown only 3.1% since 2008.

6 Outlook

Wesdome's 2014 production guidance is 50,000 gold ounces.

nimetön.png

(Source: Investor presentation)

Wesdome's global gold resources are 5.1 million ounces.

nimetön.png

(Source: Investor presentation)

7 Risks

I believe the two main risks are the gold price and relatively low gold reserves. Wesdome's production costs were C$977 per ounce in the first quarter. The company's current gold reserves in the Eagle River complex are 281,000 ounces, which will last for about five years. Wesdome is also a penny stock.

8 Conclusion

Wesdome's Eagle River mine has produced more than 950,000 ounces since 1995 at a very high grade of 9.1 g/tonne. The company's production costs were below $1,000 per ounce in the most recent quarter. Wesdome's gold resources are currently 5.1 million ounces, which gives the company ample room to grow. The insiders have been buying the stock since 2013. I believe Wesdome could be a good pick below $1 based on the insider buying.

nimetön.png

(Source: Investor presentation)

Disclosure: The author is long TSX:WDO

About the author:maarnioI have 15 years of investing experience. I have traded stocks, commodities and Forex markets.
Currently 0.00/512345

Rating: 0.0/5 (0 votes)

Email FeedsSubscribe via Email RSS FeedsSubscribe RSS Comments Please leave your comment:
More GuruFocus Links
Latest Guru Picks Value Strategies
Warren Buffett Portfolio Ben Graham Net-Net
Real Time Picks Buffett-Munger Screener
Aggregated Portfolio Undervalued Predictable
ETFs, Options Low P/S Companies
Insider Trends 10-Year Financials
52-Week Lows Interactive Charts
Model Portfolios DCF Calculator
RSS Feed Monthly Newsletters
The All-In-One Screener Portfolio Tracking Tool
iPhone App MORE GURUFOCUS LINKS
Latest Guru Picks Value Strategies
Warren Buffett Portfolio Ben Graham Net-Net
Real Time Picks Buffett-Munger Screener
Aggregated Portfolio Undervalued Predictable
ETFs, Options Low P/S Companies
Insider Trends 10-Year Financials
52-Week Lows Interactive Charts
Model Portfolios DCF Calculator
RSS Feed Monthly Newsletters
The All-In-One Screener Portfolio Tracking Tool
TSX:WDO STOCK PRICE CHART 0.88 (1y: +144%) $(function(){var seriesOptions=[],yAxisOptions=[],name='TSX:WDO',display='';Highcharts.setOptions({global:{useUTC:true}});var d=new Date();$current_day=d.getDay();if($current_day==5||$current_day==0||$current_day==6){day=4;}else{day=7;} seriesOptions[0]={id:name,animation:false,color:'#4572A7',lineWidth:1,name:name.toUpperCase()+' stock price',threshold:null,data:[[1374469200000,0.36],[1374555600000,0.365],[1374642000000,0.38],[1374728400000,0.41],[1374814800000,0.385],[1375074000000,0.4],[1375160400000,0.42],[1375246800000,0.395],[1375333200000,0.408],[1375765200000,0.395],[1375851600000,0.398],[1375938000000,0.4],[1376024400000,0.405],[1376283600000,0.38],[1376370000000,0.41],[1376456400000,0.38],[1376542800000,0.4],[1376629200000,0.395],[1376888400000,0.4],[1376974800000,0.485],[1377061200000,0.55],[1377147600000,0.65],[1377234000000,0.69],[1377493200000,0.7],[1377579600000,0.73],[1377666000000,0.67],[1377752400000,0.65],[1377838800000,0.64],[1378184400000,0.7],[1378270800000,0.68],[1378357200000,0.66],[1378443600000,0.69],[1378702800000,0.7],[1378789200000,0.67],[1378875600000,0.64],[1378962000000,0.64],[1379048400000,0.64],[1379307600000,0.63],[1379394000000,0.55],[1379480400000,0.73],[1379566800000,0.7],[1379653200000,0.66],[1379912400000,0.62],[1379998800000,0.65],[1380085200000,0.67],[1380171600000,0.69],[1380258000000,0.69],[1380517200000,0.7],[1380603600000,0.64],[1380690000000,0.61],[1380776400000,0.61],[1380862800000,0.56],[1381122000000,0.59],[1381208400000,0.66],[1381294800000,0.61],[1381381200000,0.6],[1381467600000,0.58],[1381813200000,0.56],[1381899600000,0.57],[1381986000000,0.56],[1382072400000,0.56],[1382331600000,0.59],[1382418000000,0.65],[1382504400000,0.62],[1382590800000,0.63],[1382677200000,0.66],[1382936400000,0.68],[1383022800000,0.71],[1383109200000,0.7],[1383195600000,0.66],[1383282000000,0.66],[1383544800000,0.66],[1383631200000,0.64],[1383717600000,0.68],[1383804000000,0.64],[1383890400000,0.66],[1384149600000,0.6],[1384236000000,0.57],[1384322400000,0.52],[1384408800000,0.56],[1384495200000,0.55],[1384754400000,0.51],[1384840800000,0.58],[1384927200000,0.55],[1385013600000,0.57],[1385100000000,0.55],[1385359200000,0.59],[1385445600000,0.57],[1385532000000,0.58],[1385618400000,0.62],[1385964000000,0.56],[! 1386050400000,0.58],[1386136800000,0.61],[1386223200000,0.58],[1386309600000,0.58],[1386568800000,0.58],[1386655200000,0.6],[1386741600000,0.57],[1386828000000,0.6],[1386914400000,0.58],[1387173600000,0.65],[1387260000000,0.63],[1387346400000,0.63],[1387432800000,0.62],[1387519200000,0.58],[1387778400000,0.56],[1387864800000,0.57],[1388124000000,0.63],[1388383200000,0.6],[1388469600000,0.58],[1388642400000,0.63],[1388728800000,0.63],[1388988000000,0.61],[1389074400000,0.64],[1389160800000,0.59],[1389247200000,0.61],[1389333600000,0.62],[1389592800000,0.63],[1389679200000,0.63],[1389765600000,0.65],[1389852000000,0.66],[1389938400000,0.68],[1390197600000,0.68],[1390284000000,0.73],[1390370400000,0.75],[1390456800000,0.74],[1390543200000,0.75],[1390802400000,0.68],[1390888800000,0.68],[1390975200000,0.7],[1391061600000,0.72],[1391148000000,0.67],[1391407200000,0.69],[1391493600000,0.69],[1391580000000,0.68],[1391666400000,0.68],[1391752800000,0.7],[1392012000000,0.72],[1392098400000,0.78],[1392184800000,0.74],[1392271200000,0.77],[1392357600000,0.8],[1392703200000,0.83],[1392789600000,0.8],[1392876000000,0.82],[1392962400000,0.83],[1393221600000,0.79],[1393308000000,0.76],[1393394400000,0.8],[1393480800000,0.84],[1393567200000,0.79],[1393826400000,0.95],[1393912800000,0.9],[1393999200000,0.91],[1394085600000,0.93],[1394172000000,0.91],[1394427600000,0.92],[1394514000000,0.92],[1394600400000,0.94],[1394686800000,0.94],[1394773200000,0.95],[1395032400000,0.94],[1395118800000,0.9],[1395205200000,0.8],[1395291600000,0.85],[1395378000000,0.82],[1395637200000,0.8],[1395723600000,0.74],[1395810000000,0.75],[1395896400000,0.74],[1395982800000,0.78],[1396242000000,0.73],[1396328400000,0.72],[1396414800000,0.77],[1396501200000,0.77],[1396587600000,0.8],[1396846800000,0.79],[1396933200000,0.82],[1397019600000,0.79],[1397106000000,0.78],[1397192400000,0.79],[1397451600000,0.8],[1397538000000,0.76],[1397624400000,0.76],[1397710800000,0.76],[1398056400000,0.76],[1398142800000,0.77],[1398229200000,0.77],[1398

Friday, July 18, 2014

Why Cepheid Stock Nosedived

Although we don't believe in timing the market or panicking over market movements, we do like to keep an eye on big changes -- just in case they're material to our investing thesis.

What: Shares of Cepheid (NASDAQ: CPHD  ) , a developer of molecular diagnostic tests for both clinical and non-clinical markets, plunged as much as 11% after the company reported its second-quarter earnings results following the closing bell last night.

So what: For the quarter, Cepheid reported revenue of $116.5 million, a 21% boost from the $96 million it recorded in the year-ago quarter. Cepheid's net loss still widened by 40% to $0.14, however, on an adjusted basis, it delivered $2.3 million in net income, or $0.03 per share. Comparatively, Wall Street was expecting just a $0.02 EPS profit on $115.5 million in sales, so this was a modest beat. Cepheid's CEO John Bishop also pointed out that the company placed 1,084 GeneXpert systems in the past quarter, which was more than Cepheid placed in the entirety of 2012.

Where the wheels fell off the wagon was with the company's full-year outlook. Cepheid announced a full-year revenue forecast of $452 million to $461 million and an adjusted EPS projection of $0.10-$0.13. Wall Street, on the other hand, was expecting $459.8 million in revenue (so this was more or less in-line) and $0.20 in EPS (a sizable miss).

Now what: With the increasing push toward treatment personalization through diagnostics, as well as the Affordable Care Act dropping the rate of uninsured by mandating that citizens purchase insurance or face a penalty, there's a decent chance that molecular diagnostic test developers like Cepheid are going to see demand for their products rise steadily over the long run as preventative care visits increase. But, as of right now it's incredibly tough to look past Cepheid's marginal profitability. Even stretching Wall Street's projections out to 2017 still leads to a forward P/E well in excess of 100! Unless Cepheid can find a way to rapidly grow its top line or boost its profitability, I would suggest leaving this stock to the traders.

Cepheid certainly has potential, but this revolutionary new product has enough growth opportunity to leave Cepheid eating its dust! 
The best health care investors consistently reap gigantic profits by recognizing true potential earlier and more accurately than anyone else. Let me cut right to the chase. There is a product in development that will revolutionize not just how we treat a common chronic illness, but potentially the entire health industry. Analysts are already licking their chops at the sales potential. In order to outsmart Wall Street and realize multi-bagger returns you will need The Motley Fool's new free report on the dream team responsible for this game-changing blockbuster. CLICK HERE NOW.

Thursday, July 17, 2014

Fiat Chrysler and VW Deny Report of Merger Talks

Volkswagen Fiat Chrysler Deny Report of Merger Talks Andrew Harrer/Bloomberg via Getty Images BERLIN and MILAN -- Fiat Chrysler has denied a magazine report saying it's in merger talks with Volkswagen, while the German carmaker said it had no takeovers on its agenda. Germany's Manager Magazin said Thursday Volkswagen Chairman Ferdinand Piech had held talks with the owners of Fiat Chrysler about buying all or part of the group that was formed this year from the merger of Italian and U.S. carmakers. The magazine cited unnamed company sources. However, a VW spokesman said Europe's biggest carmaker was focused on delivering improvements at its existing operations. "There are currently no [merger and acquisition] projects on the agenda," he said. "We are now focusing on boosting efficiency across the group." The Agnelli family's holding firm Exor, which owns a 30 percent stake in Fiat Chrysler, denied any talks had taken place, as did Fiat Chrysler. Shares in Fiat Chrysler jumped 5 percent to 7.98 euros on the report, but had retreated to stand up 2.2 percent by 1352 GMT (9:52 a.m. Eastern time). VW's stock was 1.8 percent lower. VW Chief Executive Officer Martin Winterkorn said in March the carmaker, though hoarding almost 18 billion euros ($24 billion) in cash, had no plans to expand the group through acquisitions as it was focusing on integrating its 12 brand network. VW has since sealed a 6.7 billion euro buyout of minority shareholders at Swedish truck division Scania to forge a long-planned alliance of its truck brands. The report could suggest "diverging views" between VW's management and the supervisory board about the carmaker's future course, said Arndt Ellinghorst, a London-based analyst at investment researchers ISI Group, at a time when Winterkorn, 67, and Piech, 77, are soon likely to face a debate over succession. Rather than talking about further expansion, top managers at VW -- concerned that profitability gains aren't keeping pace with the company's steadily growing size -- have been pushing a new efficiency program that includes 5 billion euros of cost cuts per year at the core passenger car brand. Earlier this month, VW also denied a report it was planning a bid for U.S. truck maker Paccar next year. Interested In Assets "The risks from integrating Italian plants and managing a U.S. business are material and we do not believe that the potential benefits justify the risks," Ellinghorst wrote in a note to clients. A person familiar with the situation told Reuters that VW would more likely bid for Fiat assets such as Magnetti or Alfa Romeo rather than the entire company. A member of VW's supervisory board, which oversees the management board, said the 20 member panel had at no point of time had any discussions about a purchase of Fiat. Still, Piech and Winterkorn have repeatedly expressed interest in Alfa Romeo despite rebuttals from Fiat CEO Sergio Marchionne. Manager Magazin said VW was hoping to use Chrysler's U.S. distribution network to help solve its own problems in the world's No. 2 auto market where flagging sales of the VW brand in January sparked the ouster of VW's regional chief. However, VW's U.S. troubles "are more image and pricing problems and not so much problems of distribution and manufacturing," an auto analyst said. "Buying Chrysler would not really help VW." Fiat took full control of Chrysler at the start of 2014, creating the world's No. 7 auto group, and plans to list the merged Fiat Chrysler Automobiles in New York later this year. Chief Executive Officer Sergio Marchionne has said he wants Fiat Chrysler to follow bigger rivals such as VW by building global brands and strengthening its position in the fast-growing and high-margin market for premium cars. The company is counting on its founding merger and a U.S. listing to help foot the bill for its 48 billion euro plan to grow net profit fivefold and sales by 60 percent by 2018. While rumors of a potential Agnelli family exit have surfaced over the years in Italian press, Exor has repeatedly said the stake remained a strategic investment for the family. Manager Magazin also said VW and Fiat Chrysler's owners were far from reaching an agreement about a possible price. -. MSRP: $26,495 Resale value retained after five years: 50.5 percent Even under Fiat (FIATY) ownership, some elements of Dodge's mouth-breathing, knuckle-dragging, He-Man-Woman-Haters-Club approach to auto sales managed to survive. The built-by-car-guys-for-car-guys Challenger and its rebooted muscle car aesthetic still lingers to lure meatheads who value racing stripes and rims over, oh, just about any other element of their vehicle. Ordinarily, that alone wouldn't make one of these vehicles worth a second look five years from now --  even among the most superficial gearheads. But Fiat helped the Challenger smarten up a little bit by coupling a 305-horsepower V6 engine or 375-horsepower 5.7-liter V8 Hemi with loads of interior space, real-time touchscreen navigation, traffic updates, Bluetooth connectivity,  Sirius (SIRI) XM satellite radio, keyless entry/starter and a whole lot of Harman Kardon audio upgrades.

SEC on a Dodd-Frank ‘Death March’: Gallagher

SEC Commissioner Daniel Gallagher said Wednesday that since the passage of the Dodd-Frank Act four years ago, the law’s rulemaking mandates have been an “unfettered distraction” for the securities regulator and that the agency has been on a “death march” to finish Dodd-Frank rulemakings that are unrelated to its core mission.

“The amount of time consumed” at the Securities and Exchange Commission on Dodd-Frank rulemakings that are “entirely unrelated to the agency’s core mission and entirely unrelated to what caused the financial crisis itself is a shame, and taxpayers should be horrified,” Gallagher told attendees at an event held jointly by the libertarian Cato Institute and George Mason's market-oriented Mercatus Center at the Newseum in Washington.

The event was titled "After Dodd-Frank: The Future of Financial Markets."

Gallagher opined that the root cause of the financial crisis was “failed federal housing policy and loose monetary policy,” none of which was addressed in Dodd-Frank.

While the agency has completed 42 rulemakings out of 100 mandated ones, Gallagher added that it was a “silly notion” to think that the SEC could actually meet the one- to two-year deadlines imposed by Congress.

“Unfortunately,” he said, the SEC is “still getting lots of pressure to finish the remaining 58 rulemakings on its plate.”

Indeed, in comments a day before, former Sen. Chris Dodd, D-Conn., noted that the rulemaking process at agencies “has slowed,” with agencies like the SEC having “far too many rules to implement.”

Scott O’Malia, a commissioner at the Commodity Futures Trading Commission, who spoke on the panel with Gallagher, conceded that while “four years later we’re not going to undo Dodd-Frank,” he noted the CFTC has “massive regulatory mandates, yet our capacity to implement them ourselves is just not there.”

---

Check out 20 Best Ways to Fix Dodd-Frank Act on ThinkAdvisor.

Tuesday, July 15, 2014

Is Mattel Up For A Great Q2?

The toy industry has become quite dynamic and is changing with the change in tastes and preferences of people. However, there has been a general shift to gadgets such as tablets and iPads, as children too are fond of such devices. Hence, toy sales are affected to some extent. In order to win back customer interests, the industry players are trying hard.

Industry players such as Mattel (MAT) and Hasbro (HAS) have suffered from this change. This is clearly reflected in their stock price, which has declined since the beginning of the year. Shares of Hasbro have dropped 1.5% whereas that of Mattel has dropped 17%.

The competitive front

Even if we look at the change in share price in the last one year, Mattel's stock price have decreased by 15.8%. On the contrary, Hasbro has inched up by 13.7%. This is mainly because of Hasbro's commendable efforts, which has helped in attracting customers.

For instance, Hasbro's introduction of Digital Gaming and its partnership with companies to introduce toys related to movies, such as Transformers, have been quite effective and successful. Also, it has teamed up with many retailers such as Wal-Mart, Target and Mc Donald's for its franchises.

However, Mattel too has undertaken a host of initiatives to lure more children to its products. For instance, even Mattel plans to partner with retailers so that it can attract more customers and gets a wider exposure.

Expansionary moves

Also, it plans to expand its footprint in Canada, by introducing American Doll in the region. However, this expansion will be made in partnership with Indigo Books & Music Inc., one of the largest gift, book and specialty retailers in Canada. Although this is quite a logical strategy since Canada is close to the U.S. and the brand is well-known to the Canadian people, this move has some drawbacks.

Firstly, the anti-American sentiment in Canada might force people to shun its products, resulting in huge losses for the retailer. Hence, it is better that the company did not go ahead with opening its wholly owned stores in the region. Secondly, it has a lot of competition in the Canadian market who offers similar products at a lower price. The regional players have a strong physical as well as an online presence.

Moreover, the entire feel of the American Girl brand is absent in Indigo stores, which are smaller in size and do not have any other themes, such as the Cafe area, Doll Hospital and Doll Pet Shop. These factors play an important role in the buying decision of customers in the U.S.

What to expect from Mattel this quarter?

Mattel is slated to report its second quarter results this week. Analysts expect a top line of $1.19 billion, a growth of 1.8% over last year. This is probably because of warmer weather which should attract more customers to its stores. However, the bottom line is expected to drop to $0.18 per share from $0.21 per share in the previous quarter. The company is unable to manage its costs, which is weighing on its earnings.

However, its launch of Entrepreneur Barbie might be a game changer. The new concept Barbie comes with a tablet, smartphone and a briefcase.

Mixed quarter expected

Although the new Barbie will boost Mattel's sales, enabling the retailer to meet the revenue estimate, it is difficult to say how the bottom line will change. Also, it faces stiff competition from peer Hasbro. Therefore, the second quarter looks mixed with higher revenue but a lower bottom line.

Currently 0.00/512345

Rating: 0.0/5 (0 votes)

Email FeedsSubscribe via Email RSS FeedsSubscribe RSS Comments Please leave your comment:
More GuruFocus Links
Latest Guru Picks Value Strategies
Warren Buffett Portfolio Ben Graham Net-Net
Real Time Picks Buffett-Munger Screener
Aggregated Portfolio Undervalued Predictable
ETFs, Options Low P/S Companies
Insider Trends 10-Year Financials
52-Week Lows Interactive Charts
Model Portfolios DCF Calculator
RSS Feed Monthly Newsletters
The All-In-One Screener Portfolio Tracking Tool
iPhone App MORE GURUFOCUS LINKS
Latest Guru Picks Value Strategies
Warren Buffett Portfolio Ben Graham Net-Net
Real Time Picks Buffett-Munger Screener
Aggregated Portfolio Undervalued Predictable
ETFs, Options Low P/S Companies
Insider Trends 10-Year Financials
52-Week Lows Interactive Charts
Model Portfolios DCF Calculator
RSS Feed Monthly Newsletters
The All-In-One Screener Portfolio Tracking Tool
MAT STOCK PRICE CHART 38.94 (1y: -16%) $(function(){var seriesOptions=[],yAxisOptions=[],name='MAT',display='';Highcharts.setOptions({global:{useUTC:true}});var d=new Date();$current_day=d.getDay();if($current_day==5||$current_day==0||$current_day==6){day=4;}else{day=7;} seriesOptions[0]={id:name,animation:false,color:'#4572A7',lineWidth:1,name:name.toUpperCase()+' stock price',threshold:null,data:[[1373950800000,46.33],[1374037200000,43.16],[1374123600000,43.61],[1374210000000,42.38],[1374469200000,42.08],[1374555600000,42.41],[1374642000000,42.12],[1374728400000,42.43],[1374814800000,42.77],[1375074000000,42.53],[1375160400000,42.1],[1375246800000,42.03],[1375333200000,42.7],[1375419600000,42.84],[1375678800000,42.86],[1375765200000,42.63],[1375851600000,42.33],[1375938000000,42.94],[1376024400000,42.88],[1376283600000,42.38],[1376370000000,42.57],[1376456400000,42.61],[1376542800000,42.03],[1376629200000,41.65],[1376888400000,41.61],[1376974800000,42.02],[1377061200000,41.55],[1377147600000,41.69],[1377234000000,41.73],[1377493200000,41.42],[1377579600000,40.53],[1377666000000,40.72],[1377752400000,40.39],[1377838800000,40.5],[1378184400000,40.82],[1378270800000,41.13],[1378357200000,41.11],[1378443600000,41.23],[1378702800000,41.9],[1378789200000,42.1],[1378875600000,41.86],[1378962000000,41.53],[1379048400000,42.03],[1379307600000,41.93],[1379394000000,42.12],[1379480400000,42.69],[1379566800000,43.41],[1379653200000,43.04],[1379912400000,42.67],[1379998800000,42.75],[1380085200000,42.13],[1380171600000,42.16],[1380258000000,42.09],[1380517200000,41.88],[1380603600000,42.31],[1380690000000,42.41],[1380776400000,42.18],[1380862800000,42.55],[1381122000000,41.15],[1381208400000,40.39],[1381294800000,40.76],[1381381200000,41.22],[1381467600000,41.75],[1381726800000,41.94],[1381813200000,41.55],[1381899600000,41.97],[1381986000000,42.41],[1382072400000,42.69],[1382331600000,42.72],[1382418000000,43],[1382504400000,43.161],[1382590800000,43.91],[1382677200000,44.05],[1382936400000,44.115],[1383022800000,44.91],[1383109200000,44.66],[1383195600000,44.379],[1383282000000,44.81],[1383544800000,45.54],[1383631200000,45.04],[1383717600000,44.9],[1383804000000,44.2],[1383890400000,44.17],[1384149600000,44.34],[1384236000000,44.51],[1384322400000,45.55],[1384408800000,45.84],[1! 384495200000,46.18],[1384754400000,46.05],[1384840800000,45.81],[1384927200000,45.63],[1385013600000,45.81],[1385100000000,45.71],[1385359200000,45.54],[1385445600000,45.93],[1385532000000,46.29],[1385704800000,46.27],[1385964000000,45.8],[1386050400000,45.83],[1386136800000,45.57],[1386223200000,45.79],[1386309600000,46.26],[1386568800000,46.155],[1386655200000,46.26],[1386741600000,45.43],[1386828000000,45.31],[1386914400000,45.37],[1387173600000,45.13],[1387260000000,44.7],[1387346400000,45.18],[1387432800000,45.07],[1387519200000,45.52],[1387778400000,45.97],[1387864800000,45.79],[1388037600000,46.33],[1388124000000,46.99],[1388383200000,47.82],[1388469600000,47.58],[1388642400000,47.39],[1388728800000,46.87],[1388988000000,46.62],[1389074400000,46.04],[1389160800000,45.69],[1389247200000,45.49],[1389333600000,45.26],[1389592800000,44.66],[1389679200000,44.4],[1389765600000,44.25],[1389852000000,44.35],[1389938400000,44],[1390284000000,43.4],[1390370400000,43.71],[1390456800000,42.96],[1390543200000,

MainStay jumps into MLP space with mutual funds

energy infrastructure, master limited partnerships

MainStay Investments is jumping into the white-hot master limited partnership space by absorbing three MLP mutual funds managed by Cushing Asset Management.

The funds, MainStay Cushing MLP Premier (CSHAX), MainStay Cushing Royalty Energy Income (CURAX) and MainStay Cushing Renaissance Advantage (CRZAX), will continue to be sub-advised by the Cushing team, but will now benefit from the distribution network of MainStay and its parent, New York Life Co.

“We have a very positive long-term view of growth in the energy sector,” said Kirk Lehneis, senior managing director at MainStay Investments.

MainStay president Stephen Fisher called the “U.S. energy renaissance one of the greatest economic stories or our time.”

The basic appeal of MLP investing is twofold, including access to a fast-growing energy infrastructure that is supporting the North American energy boom, as well as the income potential of investments designed to pay out most of the profit to investors.

The average dividend yield for MLP open-end mutual funds is 4.8%, but many of the funds have also generated strong total return performance this year.

Morningstar Inc. doesn't have a specific category for MLP funds, but of the 22 fund it identifies as investing in MLPs, all but one has gained more than 10% this year, and three have gained more than 21%.

Of the three MainStay Cushing funds, MLP Premier is up 13.8% this year, Royalty Energy Income is up 7.5% and Renaissance Advantage is up 14.9%.

While past performance might be a good way to start the due diligence process, lots of moving parts should be considered when it comes to investing in MLP mutual funds.

The original idea behind the MLP mutual fund was to give retail investors access to steady income generation from energy infrastructure companies.

By wrapping MLPs in a mutual fund, investors are able to avoid the complex Schedule K-1 tax reporting, which can require filing tax returns in dozens of states.

The mutual fund format generates a single Form 1099, regardless of where the underlying MLP businesses are operating.

The MLP tax benefits can be traced to the Tax Reform Act of 1986, which was designed to encourage investment in energy-related infrastructure projects such as pipelines.

Unlike traditional corporations, MLPs operate as limited partnerships and pay no tax at the company level, allowing investors to avoid the double tax on dividends.

For direct MLP investors, not only are the quarterly distributions deferred until the investment is sold, but most of the distribution is actually a return of capital, which constantly ! lowers the investor's cost basis.

Over time, the cost basis step-down process could even go into negative territory while the actual share price is climbing, creating the kind of taxable event that most investors would want to avoid.

Packaging MLPs inside a structure such as a mutual fund provides easy and diversified access to retail investors, but it also mutes many of the tax advantages, and that's what advisers should be watching.

For starters, unlike most open-end mutual funds, MLP funds typically are structured as C corporations and have to pay taxes at the corporate level.

The only way to avoid this corporate-tax drag is to limit the exposure to direct MLP ownership to 25%, otherwise the mutual fund automatically converts from a regulated investment company into a C corporation.

Fund investors in C corporation MLP funds also face the same cost basis step-down issues as direct MLP investors, because most of the fund's yield is counted as a return of capital.

In basic terms, consider an MLP fund that owns a single underlying MLP, trading at $100 per share.

In the first year, an annual distribution of 7%, or $7, would lower the cost basis by about $5, lowering the original purchase price to $95 for tax purposes.

The remaining $2 worth of annual income would be treated as a dividend distribution taxed first at the corporate level, reducing the payout to the shareholder by about 30%, then taxed again at the individual investor level as dividend income.

While it might add up to a good deal for government tax collectors, it can amount to a perplexing surprise for investors.

For advisers, the MLP space introduces a new level of due diligence because the registered retail products are not all created equal.

“There is definitely more due diligence needed to find out if a fund is a C corp. or a RIC,” said Quinn Kiley, manager of the Advisory Research MLP & Energy Income Fund (INFIX), which maintains its RIC status by limiting direct MLP ownership.

“Our! general ! take has been that if you're a large enough investor to be able to deal with the tax headache of owning MLPs directly, that's the most cost-effective and tax-efficient way to own them” he added.

When it comes to MLP exposure, retail investors also could turn to some of the closed-end funds, which will often add leverage in order to offset some of the additional tax drag. But that can introduce a different type of investment risk related to leverage.

Some exchange-traded notes also offer MLP exposure, but as Mr. Kiley explained, an ETN is essentially a fixed-income product, which introduces counterparty risk.

5 Hated Earnings Stocks You Should Love

DELAFIELD, Wis. (Stockpickr) -- Short-sellers hate being caught short a stock that reports a blowout quarter. When this happens, we often see a tradable short squeeze develop as the bears rush to cover their positions to avoid big losses. Even the best short-sellers know that it's never a great idea to stay short once a bullish earnings report sparks a big short-covering rally.

>>5 Stocks Ready for Breakouts

This is why I scan the market for heavily shorted stocks that are about to report earnings. You only need to find a few of these stocks in a year to help enhance your portfolio returns -- the gains become so outsized in such a short time frame that your profits add up quickly.

That said, let's not forget that stocks are heavily shorted for a reason, so you have to use trading discipline and sound money management when playing earnings short-squeeze candidates. It's important that you don't go betting the farm on these plays and that you manage your risk accordingly. Sometimes the best play is to wait for the stock to break out following the report before you jump in to profit off a short squeeze. This way, you're letting the trend emerge after the market has digested all of the news.

Of course, sometimes the stock is going to be in such high demand that you risk missing a lot of the move by waiting. That's why it can be worth betting prior to the report -- but only if the stock is acting technically very bullish and you have a very strong conviction that it is going to rip higher. Just remember that even when you have that conviction and have done your due diligence, the stock can still get hammered if The Street doesn't like the numbers or guidance.

>>5 Toxic Stocks You Need to Sell in July

If you do decide to bet ahead of a quarter, then you might want to use options to limit your capital exposure. Heavily shorted stocks are usually the names that make the biggest post-earnings moves and have the most volatility. I personally prefer to wait until all the earnings-related news is out for a heavily shorted stock and then jump in and trade the prevailing trend.

With that in mind, here's a look at several stocks that could experience big short squeezes when they report earnings this week.

Wolverine World Wide

My first earnings short-squeeze trade idea is apparel footwear and accessories player Wolverine World Wide (WWW), which is set to release numbers on Tuesday before the market open. Wall Street analysts, on average, expect Wolverine World Wide to report revenue of $608.50 million on earnings of 27 cents per share.

>>5 Rocket Stocks to Buy for Summer Gains

Recently, Piper Jaffray said it believes Wolverine World Wide's 2014 revenue guidance of of a 3%-to-5% increase is too optimistic. It reiterated a neutral rating on the stock with a $25 per share price target.

The current short interest as a percentage of the float for Wolverine World Wide is pretty high at 10.5%. That means that out of the 98.49 million shares in the tradable float, 10.42 million shares are sold short by the bears. The bears have also been increasing their bets from the last reporting period by 1.7%, or by about 175,000 shares. If the bears get caught pressing their bets into a strong quarter, then shares of WWW could easily rip sharply higher post-earnings as the bears jump to cover some of their trades.

From a technical perspective, WWW is currently trending above its 50-day moving average and below its 200-day moving average, which is neutral trendwise. This stock has been consolidating and trending sideways for the last month and change, with shares moving between $25 on the downside and $27.17 on the upside. Shares of WWW are starting to spike higher off its 50-day at $26.22 and it's beginning to move within range of triggering a breakout trade post-earnings above the upper-end of its sideways trading chart pattern.

If you're bullish on WWW, then I would wait until after its report and look for long-biased trades if this stock manages to break out above some near-term overhead resistance levels at $27.11 to $27.17 a share with high volume. Look for volume on that move that hits near or above its three-month average volume of 796,389 shares. If that breakout hits, then WWW will set up to re-test or possibly take out its next major overhead resistance levels at its 200-day of $28.39 to $29.93 a share. Any high-volume move above those levels will then give WWW a chance to tag or take out its 52-week high at $34.10 a share.

I would simply avoid WWW or look for short-biased trades if after earnings it fails to trigger that breakout and then drops back below some key near-term support levels at $25.66 to $25 a share high volume. If we get that move, then WWW will set up to enter new 52-week low territory below $25.06, which is bearish technical price action. Some possible downside targets off that move are $20 to $18 a share.

Cohen & Steers

Another potential earnings short-squeeze play is investment manager Cohen & Steers (CNS), which is set to release its numbers on Wednesday after the market close. Wall Street analysts, on average, expect Cohen & Steers to report revenue $77.73 million on earnings of 44 cents per share.

>>4 Stocks Spiking on Unusual Volume

The current short interest as a percentage of the float for Cohen & Steers is very high at 14.7%. That means that out of the 19.27 million shares in the tradable float, 3 million shares are sold short by the bears. This is a stock with a big short interest and a very low tradable float. Any bullish earnings news could easily spark a large short-squeeze post-earnings that forces the bears to cover some of their positions.

From a technical perspective, CNS is currently trending above both its 50-day and 200-day moving averages, which is bullish. This stock has been uptrending strong over the last six months, with shares moving higher from its low of $34.09 to its recent high of $45.02 a share. During that uptrend, shares of CNS have been consistently making higher lows and higher highs, which is bullish technical price action. That move has now pushed shares of CNS within range of triggering a big breakout trade post-earnings.

If you're in the bull camp on CNS, then I would wait until after its report and look for long-biased trades if this stock manages to break out above its 52-week high at $45.02 a share (or above Wednesday's intraday high if greater) with high volume. Look for volume on that move that hits near or above its three-month average action of 118,142 shares. If that breakout hits post-earnings, then CNS will set up to enter new 52-week-high territory, which is bullish technical price action. Some possible upside targets off that breakout are $55 to $60 a share.

I would simply avoid CNS or look for short-biased trades if after earnings it fails to trigger that breakout and then drops back below some near-term support at $41.92 a share and then below its 50-day moving average of $41.74 a share with high volume. If we get that move, then CNS will set up to re-test or possibly take out its next major support levels at its 200-day moving average of $38.69 a share to $36 to $34 a share.

Cintas

Another potential earnings short-squeeze candidate is corporate identity uniforms and business services player Cintas (CTAS), which is set to release numbers on Tuesday after the market close. Wall Street analysts, on average, expect Cintas to report revenue of $1.17 billion on earnings of 75 cents per share.

>>5 Stocks Under $10 Set to Soar

Last month, Jefferies increased its price target on Cintas to $70 per share and set a buy rating on the stock. The firm believes that improved rental end-market hiring can be boon to earnings for Cintas.

The current short interest as a percentage of the float for Cintas is notable at 6.2%. That means that out of the 100.27 million shares in the tradable float, 6.18 million shares are sold short by the bears. If the bulls get the earnings news they're looking for, then shares of CTAS could easily jump sharply higher post-earnings as the bears rush to cover some of their positions.

From a technical perspective, CTAS is currently trending above both its 50-day and 200-day moving averages, which is bullish. This stock has been uptrending strong over the last three months and change, with shares moving higher from its low of $55.65 to its recent high of $64.45 a share. During that uptrend, shares of CTAS have been making mostly higher lows and higher highs, which is bullish technical price action. Shares of CTAS are now quickly moving within range of triggering a big breakout trade post-earnings.

If you're bullish on CTAS, then I would wait until after its report and look for long-biased trades if this stock manages to break out above its 52-week high at $64.45 a share with high volume. Look for volume on that move that hits near or above its three-month average action of 493,756 shares. If that breakout materializes pos-earnings, then CTAS will set up to enter new 52-week-high territory, which is bullish technical price action. Some possible upside targets off that breakout are $75 to $80, or even $90 a share.

I would avoid CTAS or look for short-biased trades if after earnings it fails to trigger that breakout and then drops back below some near-term support at $62.22 a share to its 50-day moving average of $62.19 a share with high volume. If we get that move, then CTAS will set up to re-test or possibly take out its next major support levels at $59 to its 200-day moving average of $57.97 a share.

United Rentals

Another earnings short-squeeze prospect is equipment rental player United Rentals (URI), which is set to release numbers on Wednesday after the market close. Wall Street analysts, on average, expect United Rentals to report revenue of $1.36 billion on earnings of $1.46 per share.

>>5 Stocks Insiders Love Right Now

Just recently, KeyBanc increased its price target on United Rentals to $122 from $105. KeyBanc thinks the company will benefit from strong project activity in the Gulf Coast region. It has a buy rating on the stock.

The current short interest as a percentage of the float for United Rentals is notable at 6%. That means that out of the 96.36 million shares in the tradable float, 6.14 million shares are sold short by the bears. If this company can deliver the earnings news the bulls are looking for, then shares of URI could easily soar sharply higher post-earnings as the bears jump to cover some of their bets.

From a technical perspective, URI is currently trending above both its 50-day and 200-day moving averages, which is bullish. This stock has been uptrending strong for the last six months, with shares soaring higher from its low of $74.32 a share to its intraday high of $109.53 a share. During that uptrend, shares of URI have been consistently making higher lows and higher highs, which is bullish technical price action.

If you're bullish on URI, then I would wait until after its report and look for long-biased trades if this stock manages to break out into new 52-week-high territory above $109.53 (or above Wednesday's intraday high if greater) with strong volume. Look for volume on that move that hits near or above its three-month average action of 1.56 million shares. If that breakout hits, then URI will set up to enter new 52-week-high territory, which is bullish technical price action. Some possible upside targets off that breakout are $125 to $135, or even $140 a share.

I would simply avoid URI or look for short-biased trades if after earnings it fails to trigger that breakout and then drops back below some key near-term support levels at $105 to its 50-day at $102.13 and then below more near-term support levels at $101.80 to $100 a share with high volume. If we get that move, then URI will set up to re-test or possibly take out its next major support levels at $95 to $91, or even $88 a share.

SanDisk

My final earnings short-squeeze play is data storage devices player SanDisk (SNDK), which is set to release numbers on Wednesday after the market close. Wall Street analysts, on average, expect SanDisk to report revenue of $1.60 billion on earnings of $1.39 per share.

Just this morning, Stifel raised its price target on SanDisk to $114 from $95. Stifel expects the company's June quarter results to beat consensus estimates and predicts that SanDisk's guidance for its September quarter may also beat expectations. Stifel maintained its buy rating on the stock.

The current short interest as a percentage of the float for SanDisk stands at 7%. That means that out of the 225.38 million shares in the tradable float, 16.28 million shares are sold short by the bears. If this company can deliver the earnings numbers the bulls are looking for, then shares of SNDK could easily trend sharply higher post-earnings as the bears rush to cover some of their bets.

From a technical perspective, SNDK is currently trending above both its 50-day and 200-day moving averages, which is bullish. This stock has been uptrending strong for the last six months, with shares moving higher from its low of $66.62 to its recent high of $106.93 a share. During that uptrend, shares of SNDK have been making mostly higher lows and higher highs, which is bullish technical price action. That move has now pushed shares of SNDK within range of triggering a major breakout trade post-earnings that could push the stock into new 52-week-high territory.

If you're in the bull camp on SNDK, then I would wait until after its report and look for long-biased trades if this stock manages to break out above its 52-week high at $106.93 a share (or above Wednesday's intraday high if greater) with high volume. Look for volume on that move that hits near or above its three-month average volume of 3.29 million shares. If that breakout gets underway post-earnings, then SNDK will set up to enter new 52-week-high territory, which is bullish technical price action. Some possible upside targets off that breakout are $120 to $130, or even $135 a share.

I would avoid SNDK or look for short-biased trades if after earnings it fails to trigger that breakout, and then drops back below some key near-term support levels at $102.50 to $101.70 a share with high volume. If we get that move, then SNDK will set up to re-test or possibly take out its next major support levels at its 50-day moving average of $97.66 to $95 a share. Any high-volume move below those levels will then give SNDK a chance to tag $90 to $87 a share.

To see more potential earnings short squeeze plays, check out the Earnings Short-Squeeze Plays portfolio on Stockpickr.

-- Written by Roberto Pedone in Delafield, Wis.


RELATED LINKS:


>>5 Big Trades to Conquer a Correcting Market


>>5 Stocks Hedge Funds Love This Summer


>>4 Hot Stocks on Traders' Radars

Follow Stockpickr on Twitter and become a fan on Facebook.

At the time of publication, author had no positions in stocks mentioned.

Roberto Pedone, based out of Delafield, Wis., is an independent trader who focuses on technical analysis for small- and large-cap stocks, options, futures, commodities and currencies. Roberto studied international business at the Milwaukee School of Engineering, and he spent a year overseas studying business in Lubeck, Germany. His work has appeared on financial outlets including

CNBC.com and Forbes.com.

You can follow Pedone on Twitter at www.twitter.com/zerosum24 or @zerosum24.


Monday, July 14, 2014

Apple Banks on Desire for Rugged iPhone 6 Screen

Any previous estimates of iPhone 6 sales need to be tossed out.

Evidence that Apple Inc.'s (Nasdaq: AAPL) next-generation smartphone will include a virtually unbreakable sapphire screen will push sales far beyond earlier expectations, which means that Apple stock at below $100 is significantly undervalued.

#symbols-c4ca4238a0b923820dcc509a6f75849b { width: 253px; font-family: Arial; font-size: 11px; color: #333333; } #symbols-c4ca4238a0b923820dcc509a6f75849b .header { float: left; font-family: Georgia; font-size: 14px; color: #456626; line-height: 14px; padding-left: 14px; font-weight: bold; } #symbols-c4ca4238a0b923820dcc509a6f75849b .date { float: right; padding-right: 32px; font-weight: bold; } #symbols-c4ca4238a0b923820dcc509a6f75849b .chart { font-family: Georgia; font-size: 12px; color: #456626; width: 253px; height: 135px; line-height: 135px; text-align: center; } #symbols-c4ca4238a0b923820dcc509a6f75849b ul { list-style: none; padding: 0; margin: 0; } #symbols-c4ca4238a0b923820dcc509a6f75849b li { padding: 0; margin: 0; } #symbols-c4ca4238a0b923820dcc509a6f75849b li:nth-child(odd) { background-color: #eeebe6; } #symbols-c4ca4238a0b923820dcc509a6f75849b .symbols-item .name { float: left; width: 100px; overflow: hidden; padding: 3px; } #symbols-c4ca4238a0b923820dcc509a6f75849b .symbols-item .price { float: left; width: 55px; overflow: hidden; padding: 3px; text-align: right; } #symbols-c4ca4238a0b923820dcc509a6f75849b .symbols-item .percent { float: left; width: 80px; overflow: hidden; padding: 3px; text-align: right; } #symbols-c4ca4238a0b923820dcc509a6f75849b .symbols-item.active { background-color: #456626; color: #ffffff; } #symbols-c4ca4238a0b923820dcc509a6f75849b .chart-container { width: 253px; height: 135px; padding: 0 0 5px 0; } #symbols-c4ca4238a0b923820dcc509a6f75849b .chart-container img { width: 253px; height: 135px; max-width: none; } .clear { clear: both; } Apple NASDAQ: AAPL Jul 14 12:22 PM loading chart... Price: 96.80 | Ch: 1.58 (1.6%)

The Cupertino, Calif.-based tech giant used sapphire covers for the camera and fingerprint-reading home button in the iPhone 5s, but a sapphire screen is a major upgrade. Not only is it almost perfectly transparent with no distortions or discolorations of any kind, it's also next-to-impossible to scratch or crack.

That's the sort of must-have feature that by itself could induce huge demand. How many people do you know that have had their smartphones' screens scratched by the keys in their pocket, or cracked after an accidental drop?

But when you combine this nearly indestructible screen with the other upgrades we know about (such as bigger screen sizes and new health and fitness monitoring capabilities), it's obvious the iPhone 6 will exceed the sales of any previous model by a large margin.

So how do we know about this remarkable sapphire screen?

Apple stockRumors like this often come from sketchy sources in AAPL's Asian supply chain, but in this case we actually have video evidence, one from blogger Marques Brownlee and another made in China.

Both were able to get a sample of the iPhone 6 screen, and both spared no effort in trying to inflict damage. The screen withstood the scratching of keys, severe bending, being struck with a hammer, exposure to flame, and repeated jabbing with a large, sharp knife. In every case, the iPhone 6 screen emerged without a scratch.

Only the folks who made the Chinese video were able to destroy the sapphire screen - by running over it with a car.

With the iPhone 6 virtually guaranteed to be a runaway hit, let's look at how it will affect AAPL stock.

What the iPhone 6 and Its Sapphire Screen Will Do for Apple Stock

AAPL knows it has a winner on its hands. Taiwan's Business Weekly did an extensive analysis of Apple's iPhone supply chain and this week estimated that Apple's initial iPhone 6 order will exceed 68 million units.

That's a stunning number when you consider that Apple sold a total of 51 million iPhones - including all models - in the December quarter (the iPhone 5s and iPhone 5c debuted Sept. 11).

If Apple follows precedent, the iPhone 6 will debut near the end of the September quarter, setting up what should turn out to be a record December quarter.

And while AAPL has many profitable businesses, for now the iPhone is the primary revenue engine, accounting for about half of the company's revenue and more than half of its profits.

If the iPhone 6 raises total iPhone sales by 25% in the year following its launch, it will add about $26 billion in revenue, which is big enough to affect even Apple's top line, at $176 billion over the past 12 months.

Previous estimates had put the iPhone 6's impact on the AAPL stock price at about 10%; the sapphire screen should add several more percentage points. Currently trading at about $95, Apple stock should easily blow past its all-time high ($101.74) this summer on its way to somewhere around $110 by the end of the year.

Beyond its fruitful impact on Apple stock, the sapphire screen will affect two other companies - one positively, the other negatively.

The company that gets dinged is Corning Inc. (NYSE: GLW), which makes the Gorilla Glass that Apple has used in the iPhone, iPad, and iPod Touch until now. As Apple adopts the sapphire screens throughout its mobile product lines, Corning will lose a significant chunk of business.

Not surprisingly, Corning has been openly critical of sapphire screens, saying they cost too much (although it can't criticize the thickness or weight - the sapphire displays are thinner and lighter than Gorilla Glass).

But Apple is very good at getting components as cheaply as possible, which brings us to the winning company in this transition: GT Advanced Technologies Inc. (Nasdaq:
GTAT).

Apple made a deal last year with GT Advanced to open and operate a manufacturing facility for sapphire components in Mesa, Ariz. (which happened in February). The factory at present is capable of producing about 200 million sapphire displays a year - just about what Apple will need.

But if Apple starts using the sapphire screens in its other devices, GT Advanced will need to expand its operations. It represents a lot of new business for GTAT, although an exclusivity clause will prevent the company from selling to Apple rivals like Samsung Electronics Ltd. (OTCMKTS: SSNLF).

It also means Apple will be able to use those sapphire screens as a unique selling point for years to come - a smart move that's also bound to pay off.

What's your take on the impact of the iPhone 6 on Apple stock? Do you agree it will have a major impact? Speak your mind on Twitter @moneymorning or Facebook.

UP NEXT: There's yet another catalyst for Apple stock that is just now gaining traction, but unlike the iPhone this one has received very little attention. It's a technology that could change the very way people shop and interact with businesses. It's called iBeacon...

Related Articles:

International Business Times: iPhone 6 Release Date: Sapphire Screen Unbreakable, Withstands Knife Stab

Sunday, July 13, 2014

Two Charts That Show Bitcoin Is About to Take Off

While the Bitcoin market has had its ups and downs, what matters is that it is a major new technology that will disrupt the financial sector, and probably several others as well.

And that means Bitcoin should follow the same dramatic patterns as other disruptive technologies - which, so far, it has.

bitcoin marketOne chart was developed by research firm Gartner, Inc., and is known as the Gartner Hype Cycle. It's intended as a tool to help investors and business executives assess where an emerging technology stands so they can determine when the time is right to jump in.

Let's take a look at where the Bitcoin market fits in with the Gartner chart.

The technology trigger for Bitcoin was its invention in 2009, although the digital currency flew mostly under the radar of the mainstream media until last year.

We had a peak of inflated expectations last fall when the Bitcoin price spiked to over $1,100.

And Bitcoin also has suffered through the "trough of disillusionment." That's characterized by such events as negative press (for example, stories denouncing the Bitcoin market as a "bubble") and supplier consolidation and failures (like the bankruptcy of the Mt. Gox Bitcoin exchange).

But it's also characterized by an increase in venture capital funding, which is on pace to more than double in 2014 from last year.

So going by the Gartner chart, the Bitcoin market is either at the bottom of the trough or just coming out of it. A technology that reaches this stage is on the verge of a sustained period of rapid growth - the "slope of enlightenment."

Clearly, this is the ideal point to jump into a new technology - after the shake-out period when weak players fail, but well before it reaches the mass adoption stage.

And that brings us to the second chart, a bell curve that illustrates how quickly a new technology is adopted by the population - the "technology adoption rate."

Once the Bitcoin Market Moves Past the Early Adopters - Watch Out

Most new technologies are initially used by just a few tech-savvy pioneers, a circle that gradually extends to the so-called "early adopters."

bitcoin marketIt helps to think of this phase - where the Bitcoin market currently finds itself - in terms of other technologies that now fall on the right side of the chart.

Many of Bitcoin's most fervent supporters, such as venture capitalist Marc Andreessen, like to compare the digital currency now to the Internet of the early 1990s. Andreessen would know - his Netscape web browser helped accelerate widespread adoption of the Internet in 1994.

At this point, 20 years later, the Internet has moved to the "laggards" phase, while along the way driving hundreds of billions of dollars in investments.

Or you can look at Facebook, Inc. (Nasdaq: FB). From its start as a social network for a few thousand Harvard University students in 2004, Facebook is now a global corporation with more than 1.2 billion active users and a market cap of $172 billion.

In only 10 years, Facebook moved from one side of the graph to the other.

It may be tempting to dismiss the Bitcoin market now because it's so small, but as the chart shows, only 15% or so of all potential Bitcoin users have adopted it.

The adoption rate of a technology is important - and especially so in the case of Bitcoin - because of something called the "network effect."

Simply put, the more people adopt a technology, the more useful it becomes. In other words, having e-mail back in the 1990s wasn't very useful when only a handful of people had it. But once a critical mass of people had it, e-mail became a virtual necessity.

Because part of Bitcoin's utility rests on the number of people using it, rapid growth in its adoption rate will feed on itself, drawing more and more people in. And that will generate tremendous demand within the growing Bitcoin market, driving the Bitcoin price to the crazy-high levels that some already have predicted.

Michael Terpin, the co-founder of BitAngels, an angel investor group for digital currency startups, in a Barron's column last week extrapolated a future price of $50,000 per bitcoin - 77 times the current Bitcoin price of $650.

"Even in these early days [Bitcoin] has the potential to disrupt large sectors of the financial, banking, e-commerce, and securities markets in ways that could create wealth across its various components in excess of $1 trillion," Terpin said. "Despite the (increasingly unlikely) prospect of it going to zero, the upside makes it an important portfolio driver in the high-risk portion of a balanced portfolio for those who are savvy enough to take on the learning curve."

UP NEXT: Right now U.S. investors can't buy a Bitcoin stock on a major U.S. exchange. But there's an ambitious Bitcoin mining company that has vowed to go public on a major exchange within the next year. This could well be the first Bitcoin IPO ever...

Related Articles:

Barron's: Is Bitcoin for You? Gartner Inc.: The Hype Cycle

Saturday, July 12, 2014

U.S. Records $71 Billion Budget Surplus in June

Budget Deficit J. Scott Applewhite/AP WASHINGTON -- The U.S. government ran a monthly budget surplus in June, putting it on course to record the lowest annual deficit since 2008. The Treasury Department said Friday that its June surplus totaled $71 billion, following a $130 billion deficit in May. The government also ran a surplus in June 2013, bolstered by dividends from Fannie Mae, the mortgage giant under federal conservatorship for the past six years. For the first nine months of this budget year, the deficit totals $366 billion, down 28 percent from the same period in 2013. Tax receipts are up 8 percent compared to the prior year-to-date, while spending has increased 1 percent. The Congressional Budget Office is forecasting a deficit of $492 billion for the full budget year ending Sept. 30. That would be the narrowest gap since 2008. In 2008, the government recorded a deficit of $458.6 billion, which was the record high for deficits up to that time. But with the outbreak of the recession, deficits soared to unprecedented levels, exceeding $1 trillion for four consecutive years. Tax revenues fell during that period, while government boosted spending in an attempt to stabilize the financial system and provide relief to people who had lost jobs. The yearly deficit peaked at $1.4 trillion in 2009 during the worst of the financial crisis. It gradually fell from there, plunging to $680.2 billion last year. Over the next decade, CBO is projecting that the deficits will total $7.6 trillion. The deficit will fall to $469 billion in 2015 before rising again and topping $1 trillion annually starting in 2023, according to the CBO. Spending on the government's major benefit programs, including Social Security and Medicare, will drive those increases as more baby boomers retire. Republicans have accused President Barack Obama of failing to propose significant cost cuts to reduce soaring entitlement costs. Democrats counter that Republicans would rather impose sharp cuts on needed government programs than impose higher taxes on the wealthy. Neither side is expected to make major concessions in this congressional election year. But the budget wars of the past three years have subsided at least for a brief time. An agreement was reached in December on the broad outlines for spending over the next two years. The agreement will allow Washington to avoid the gridlock that culminated in October's 16-day partial shutdown of the government. The budget cease-fire also includes legislation that will suspend the government's borrowing limit through March 15 of next year. That puts off another battle over raising the debt ceiling until a new Congress takes office in January.

Thursday, July 10, 2014

Investors Capital shareholders back Schorsch's RCS Capital merger

nicholas schorsch, rcs capital, rcap, investors capital, shareholders, merger, deal, M&A

Investors Capital Holdings Ltd. said Tuesday its shareholders had approved the terms of the merger with RCS Capital Corp., best known by its ticker symbol RCAP. Announced last October, the deal is scheduled to close on Friday, Investors Capital said in a statement Tuesday.

Buying Investors Capital Holdings for $52.5 million in cash and stock was one of five separate acquisitionsby RCAP and its executive chairman Nicholas Schorsch to build a far-ranging network of independent broker-dealers that are home to 9,000 registered representatives and advisers. Investors Capital Holdings is the last of those announced acquisitions to close.

According to a filing with the Securities and Exchange Commission, Investors Capital shareholders will receive $7.25 in cash per share or an equal consideration of RCAP stock, which was trading at $21.50 on Wednesday morning in New York.

The biggest asset of Investors Capital Holdings is its independent broker-dealer, Investors Capital Corp. The firm had 441 producing reps and advisers in 2013 and total revenues of $93.2 million.

At the end of June, RCAP said it had closed its previously announced acquisition of the Hatteras Funds Group, a family of alternative investment mutual funds. Hatteras Funds will continue to operate under current management and the Hatteras brand.

Wednesday, July 9, 2014

Acasti, Kandi, and Amarantus: Cures for the Summertime Blues? (AMBS, KNDI, ACST)

What do Acasti Pharma Inc. (NASDAQ:ACST), Kandi Technologies Group Inc. (NASDAQ:KNDI), and Amarantus Bioscience Holdings, Inc. (OTCBB:AMBS) have in common? Not a lot, if you're simply looking at their business lines. Kandi Technologies Group makes electric cars, and even though Amarantus Bioscience Holdings and Acasti Pharma are both in the pharmaceutical arena, they're not too much alike. There is one common element among AMBS, ACST, and KNDI right now, however... they're three of the market's most bullish setups. Anyone looking for a new trading idea here should start with one of these three.

If the name Amarantus Bioscience Holdings rings a bell, it may be because yours truly took a thorough trading look at it back on December 18th... the last time AMBS shares started to push up and off of rising support line. Sure enough, the stock took off, rallying from $0.0529 then to a high $0.139 by late January. As has been the MO for quite some time, however, shares peeled back from that high to the lower side of the rising trading range again. And once again, they pushed up and off that rising floor.

So what? Amarantus Bioscience Holdings shares are back in an uptrend spurred by support at that floor. Although we'd prefer to step in closer to the beginning of the rally, there's still plenty of room to keep rising before the upper edge of the trading range is met.

Kandi Technologies Group may be even more familiar, in that the last time it was scrutinized was a much more recent June 16th. The shtick then was simply that even though KNDI was hinting at a bullish breakout, it would first need to clear a major ceiling at $13.72 before becoming trade-worthy. That $13.72 mark was not only where the 100-day moving average line was at the time, but also where the stock had topped out several times since mid-April.

Care to guess what's happened to the stock in the meantime? Yes, Kandi Technologies Group shares have quietly cleared the hurdle at $13.72. We've seen some high-volume days behind the bullish effort too. Today's modest, lull-like day could be a great entry opportunity into the budding uptrend from KNDI.

Last but not least, Acasti Pharma is up an impressive 14.5% today. That's not the compelling aspect of this stock right now, however. What makes ACST worth a second look here is that fact that this is the second bullish thrust we've seen from the stock in the past three weeks, with this one being on very high volume. The bulls aren't going away. Indeed, it almost looks like they've been launched out of a slingshot, using some key moving averages as the springboard.

To fully appreciate just how much of a paradigm shift is unfurling for ACST, however, one has to take a step back and look at the weekly chart below. This is the most bullish promise we've seen in a year, and there's a ton of room for Acasti Pharma to rebound now. The high-volume reversal effort simply says now's the time it's starting to happen.

Looking for something a little bigger? Take a look at the SmallCap Network Elite Opportunity service. It trades large cap companies, in addition to providing you daily market insight and close looks at major market trends. You can even get a free two week trial. Just click here to learn more.